I have lost orders because an edge looked “off.” I fixed that by building a repeatable color workflow. (PAS)
We match edge banding to major board brands by using measured color data, physical proofs, and supplier traceability. This process keeps matches consistent and reduces returns.

Color is easy to notice and hard to control. I will show the steps we use to match edges to Egger, Arauco and other brands. Follow these steps to make matches predictable and scalable.
Why Matching Edge Banding Colors with Major Board Brands Matters?
Customers cancel orders when finishes do not match. I felt the cost of one returned shipment. (PAS)
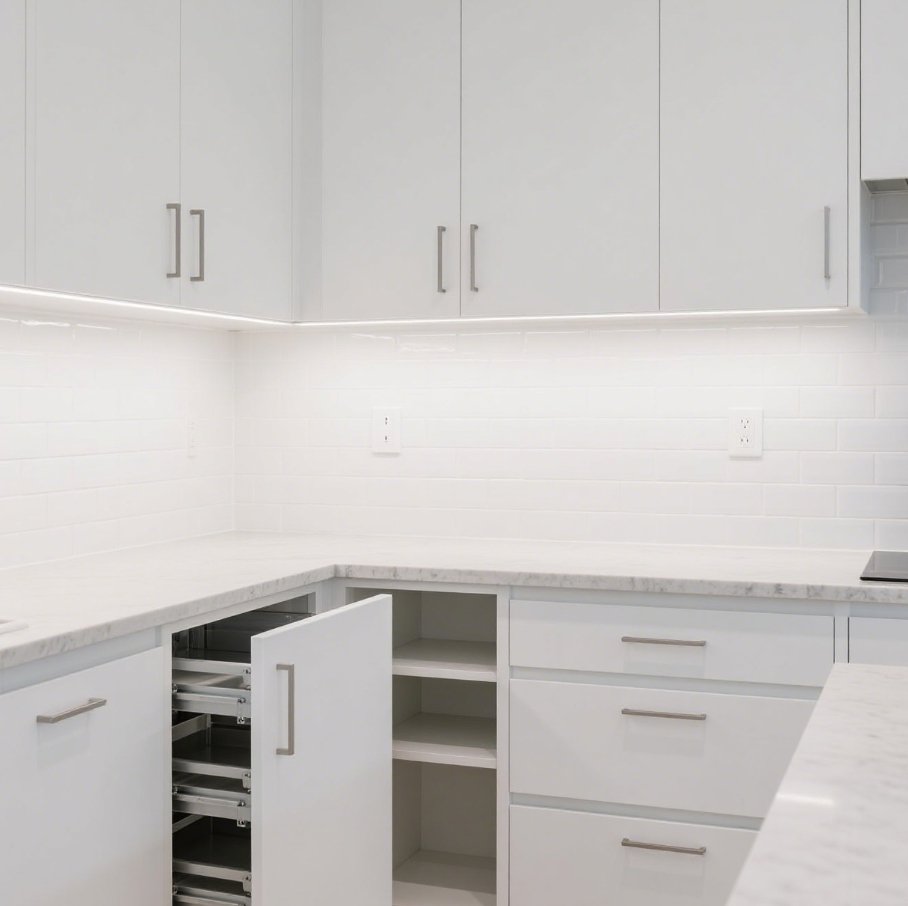
Matching edges to major boards matters because it keeps designers and factories confident in the final product. When color agrees, orders grow and disputes shrink.

Dive deeper: the business and technical reasons we treat matching as critical
I treat matching as both a technical task and a sales tool. Buyers and designers see small differences first. A visible mismatch can stop a sale or cause a production hold. That is the business risk I try to remove.
Technically, color lives in numeric space. I use CIE Lab and ΔE to compare samples. A ΔE value tells me how far two colors are apart. In practice, most finish teams aim for ΔE values below 2–3 for furniture finishes. That range often keeps differences invisible in normal use. Using these metrics makes acceptance objective.
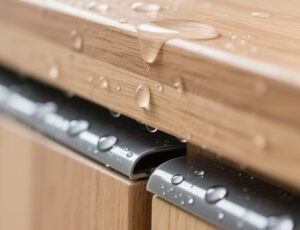
Materials matter. PVC, ABS, and veneers reflect light differently. The same color recipe can look different on different substrates. I compare the board and edge on the actual substrate types we will deliver. I also record gloss since sheen changes how humans perceive color.
Matching major brands gives sales power. Brands like Egger produce large, consistent decor collections and publish technical datasheets for their edge programs. When I can say I match Egger or Arauco decors, customers trust me more. I rely on official matching guides and cross-reference resources when I prepare offers.
Understanding the Color Systems Used by Egger, Arauco, and Other Board Brands?
A customer once asked for “the Egger color.” I learned fast that brands use codes, textures, and gloss levels, not just names. (PAS)
Egger and Arauco publish decor collections and edge programs. They use catalog codes and finish descriptors that we must follow to find the right match and sample.

Dive deeper: how these brands organize color data and how I use it
Major board brands structure color information in three linked parts: decor code, finish/texture, and gloss level. I always ask for the full spec. A decor code alone is not enough. I need the texture type (for example, matt, super-matt, woodgrain) and the gloss or sheen number. Egger offers technical datasheets and edge collections that show matching edge types and processing notes. I use those resources to build my sample list.
I map brand codes to our edge SKUs. Many suppliers and distributors publish cross-reference tables that map brand board numbers to edge banding SKUs. Those tables speed up quoting and sample pulls. For Arauco, several extruders and distributors maintain Arauco match libraries and stock matched rolls. I keep a local copy of the cross-reference PDFs and update them when suppliers publish new collections.
I also consider the production method. Some decors are best matched by extrusion (PVC/ABS), some by laser edge, and some by printed ABS. I capture the recommended edge type from the board brand when available. That reduces surprises in assembly.
Finally, I log the board batch or lot number. Boards can have small lot-to-lot shifts. When a client orders large volume, I ask for the board batch number so we can match the correct shade. This small step prevents mid-job mismatches.
Our Step-by-Step Process to Achieve Perfect Color Matching?
I once wasted time making a full run without a pilot. I now follow a strict sample and pilot workflow. (PAS)
We use a clear workflow: request sample, measure, set tolerance, pilot, approve, then run. This keeps color checks fast and reliable.
Dive deeper: the practical workflow, roles, and a table you can copy
Below is the workflow I use every time. I share the roles so teams know who does what.
Workflow table
| Step | Action | Responsible |
|---|---|---|
| 1 | Get physical board sample with decor code and lot number | Client / Buyer |
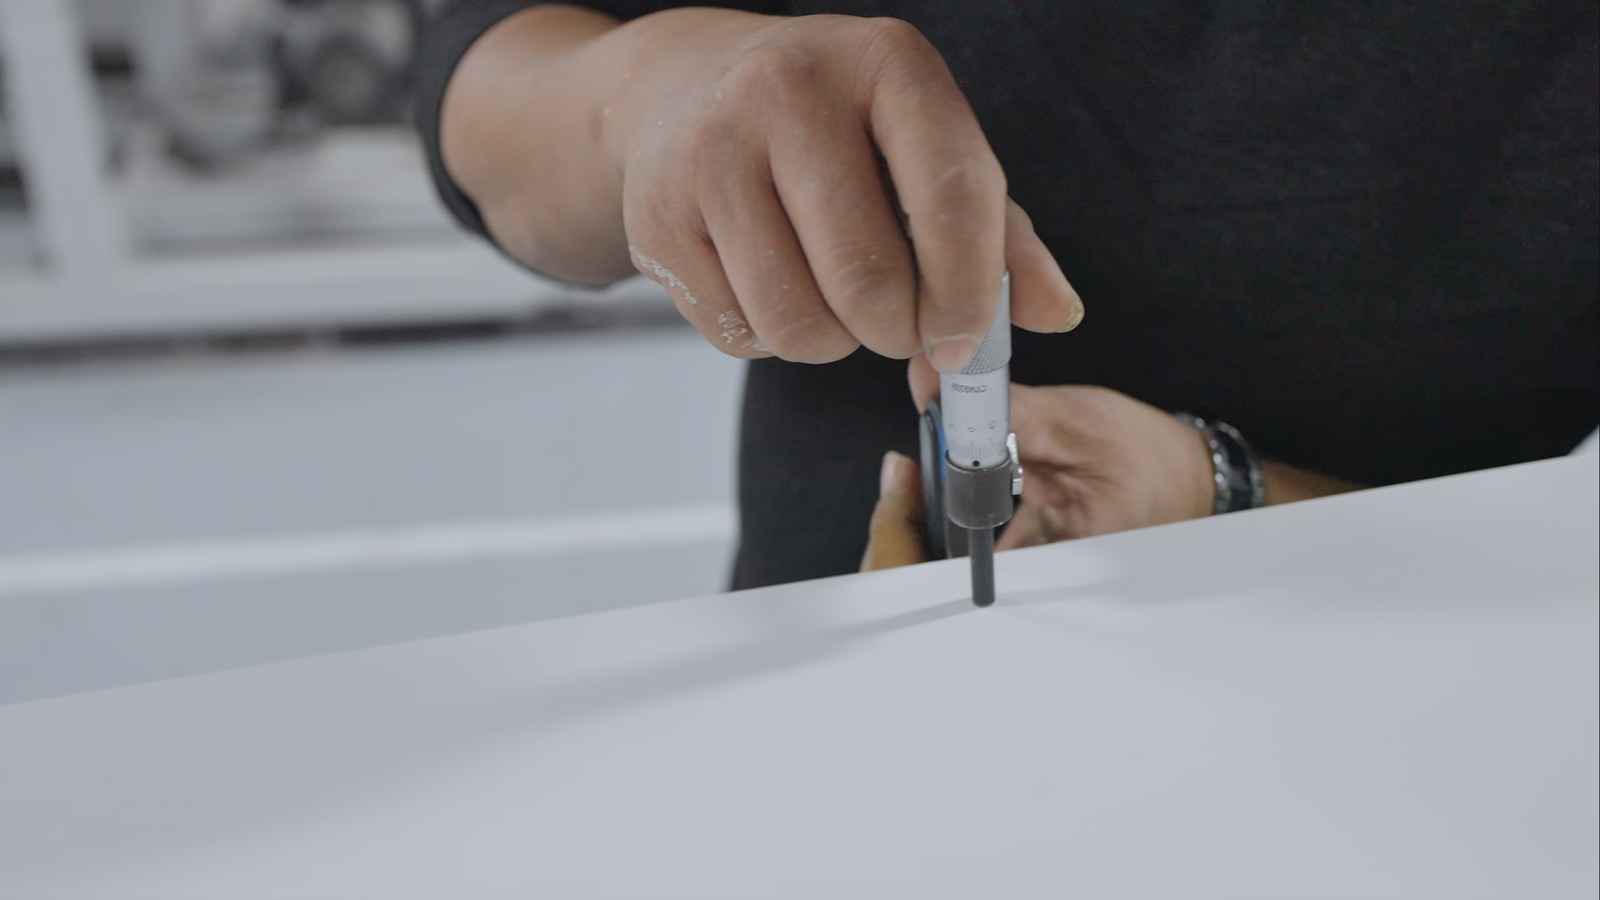
| 2 | Measure board with spectrophotometer, record Lab values | QA |
| 3 | Request or produce a pilot edge strip | Supplier |
| 4 | Measure pilot edge against board, calculate ΔE (CIEDE2000) | QA |
| 5 | Assemble a proof (edge on board) and view under target lighting | QA + Client |
| 6 | Approve or request adjustment; sign off in writing | Client |
| 7 | Release full production with lot traceability | Supplier / QA |
I explain key steps.
Measure and record. I use a spectrophotometer to capture CIE Lab* and compute ΔE using CIEDE2000. That formula gives perceptually relevant results for furniture finishes. I save those readings in a shared file. This file acts as our color contract.
Pilot and proof. I never skip a pilot run for new decors or new suppliers. A printed or extruded pilot strip assembled onto the board under the intended light shows real-world results. I ask clients to sign off on that assembled proof before full orders.
Tolerances and documentation. I set explicit tolerances (for example, ΔE ≤ 2 or ≤ 3 depending on finish). I add gloss targets in GU and document measurement geometry. Both sides sign the technical acceptance.
Traceability. I require lot numbers for both board and edge. If a batch falls out of tolerance, traceability helps us find and fix the root cause quickly.
This process is practical and repeatable. It reduces rework and protects margin. It also gives clients measurable proof they can trust.
Tools and Technologies Behind Accurate Edge Banding Color Matching?
I started with a handheld colorimeter. Then I upgraded to lab-grade instruments and a color database. Each step improved our hit rate. (PAS)
Key tools: spectrophotometers, gloss meters, color libraries, and sample management systems. These tools make matching measurable and repeatable.
Dive deeper: specific tools, how we use them, and best practices
I use four tool groups.
1. Spectrophotometers / color readers. These give CIE-Lab values and support ΔE calculations. I calibrate them daily with manufacturer tiles. I measure both board and edge with the same device and settings. That removes device variation. Follow device guides to maintain accuracy and repeatability.
2. Gloss meters. I measure gloss units because sheen changes perceived color. I log GU together with Lab values. This dual record avoids “it matches in color but not in sheen” problems.
3. Color libraries and brand cross-references. I store board brand codes, Lab targets, and approved edge SKUs in a simple database. When a client asks for an Egger decor, I can pull the Lab target and suggest the matching edge SKU and expected ΔE tolerance. Many distributors and extruders publish cross-reference charts that I import into our system.
4. Sample management and proofing. I keep a physical sample book with matched edge strips keyed to board codes. I also keep scanned Lab records for each sample. For large clients, I create a digital “color passport” per SKU that includes Lab data, gloss, photos of the assembled proof under target lighting, and lot numbers.
Best practices I follow include standardizing measurement geometry, calibrating instruments before each session, and using CIEDE2000 for ΔE reporting. These small steps reduce noise and give me confidence in published tolerances.
How Consistent Color Matching Builds Trust with Distributors and Furniture Brands?
A repeat client told me: “Your sample book changed our supplier shortlist.” That trust came from consistent results. (PAS)
Consistent color matching reduces disputes, shortens buying cycles, and opens higher-value projects. It turns a commodity seller into a preferred partner.

Dive deeper: measurable benefits and the customer-facing value chain
I measure two KPIs: first-pass acceptance rate and claim frequency. When I improved measurement and added pilot proofs, acceptance rates rose and claims dropped. That improvement freed our sales team to pursue bigger orders.
Trust shortens negotiation. When clients accept submitted Lab reports and pilot proofs, they skip long back-and-forths. Contracts close faster. That speeds revenue recognition.
Consistent matching also helps marketing. I use proof images and Lab-backed claims in proposals. Designers respond to proven color systems that match Egger and Arauco collections. That credibility leads to specification on projects and larger, longer contracts.
Operationally, consistency reduces waste. Fewer rejects mean less rework, lower freight costs, and better margins. For the factory, that translates into more stable schedules and better utilization.
Finally, a measurable approach scales. You can train teams, onboard new suppliers, and expand to new markets when your color system is documented and measurable. That is the business value I sell to clients every day.
Conclusion
I match edges to major board brands with measured data, proofs, and traceable processes. That approach wins trust and reduces risk.
Data sources and links
- EGGER — Edge Banding and technical datasheets. https://www.egger.com/edge-banding. (埃格尔)
- Arauco matching resources and cross-reference guides. https://www.rehau.com/downloads/1532994/arauco-cross-reference.pdf. (REHAU)
- Datacolor — Best practices for ΔE tolerances and spectrophotometer use. https://www.datacolor.com/business-solutions/blog/best-practices-delta-e-tolerances/. (Datacolor)
- X-Rite — Guides to color measurement and device best practices. https://www.xrite.com/-/media/xrite/files/whitepaper_pdfs/l10-001_understanding_color_en.pdf. (xrite.com)
- CIEDE2000 / ΔE background and implementation notes. https://www.researchgate.net/publication/227603423_The_CIEDE2000_color-difference_formula_Implementation_notes_supplementary_test_data_and_mathematical_observations. (ResearchGate)